Graphing multiple parameter codes and sites
The following examples will provide instructions and tips for graphing multiple parameter codes and sites. The first graphing example demonstrates the steps necessary to produce a plot showing three parameter codes for a typical stream site (PMPS). The second graphing example demonstrates the steps necessary to produce a plot showing two sites for a typical parameter code such as water temperature. The following page contains the options to both graphs. The option for the PMPS graph is noted by the "new" icon located in the "Available Parameters" directly below. The option for the PMSP graph is located right of the image graph where the "Add site numbers" and "GO" are shown.
Steps to produce graphs for PMPS (multiple parameter codes for a single site)
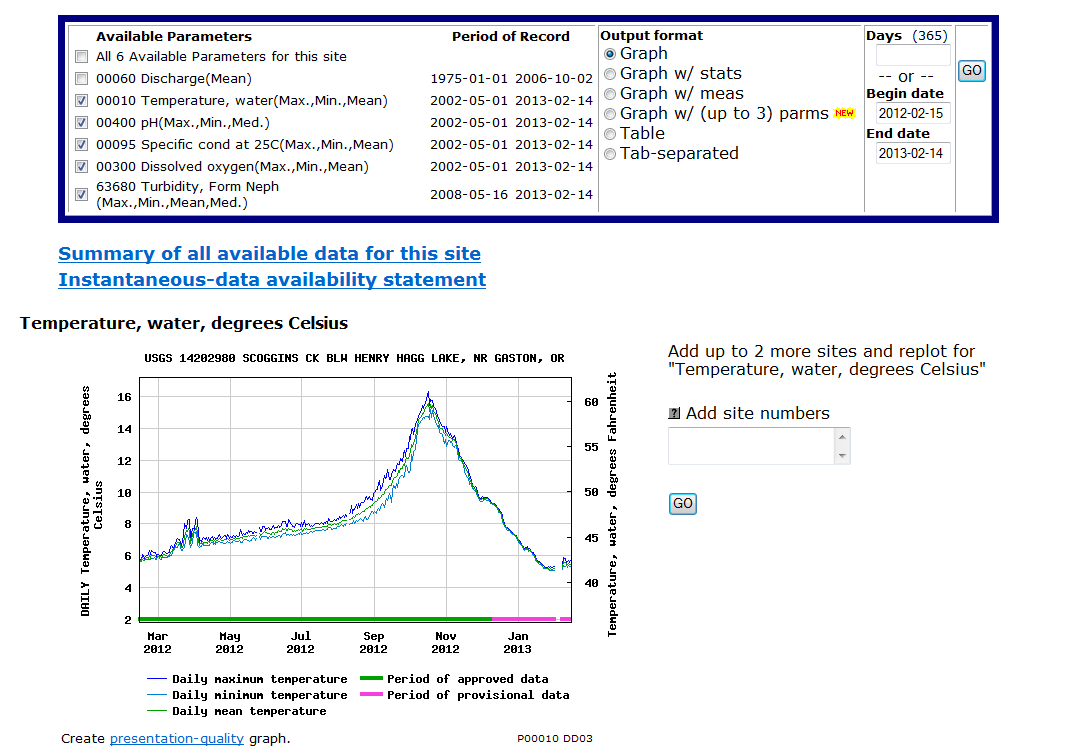
To produce a PMPS graph, one would choose up to 3 parameter codes from the "Available Parameter" section and enable the button for "Graph w/(up to 3) parms" and then click the "GO" button. These steps are outlined in red in the figure below. If these conditions of the options are not met correctly, a message will be enabled that will provide additional help.

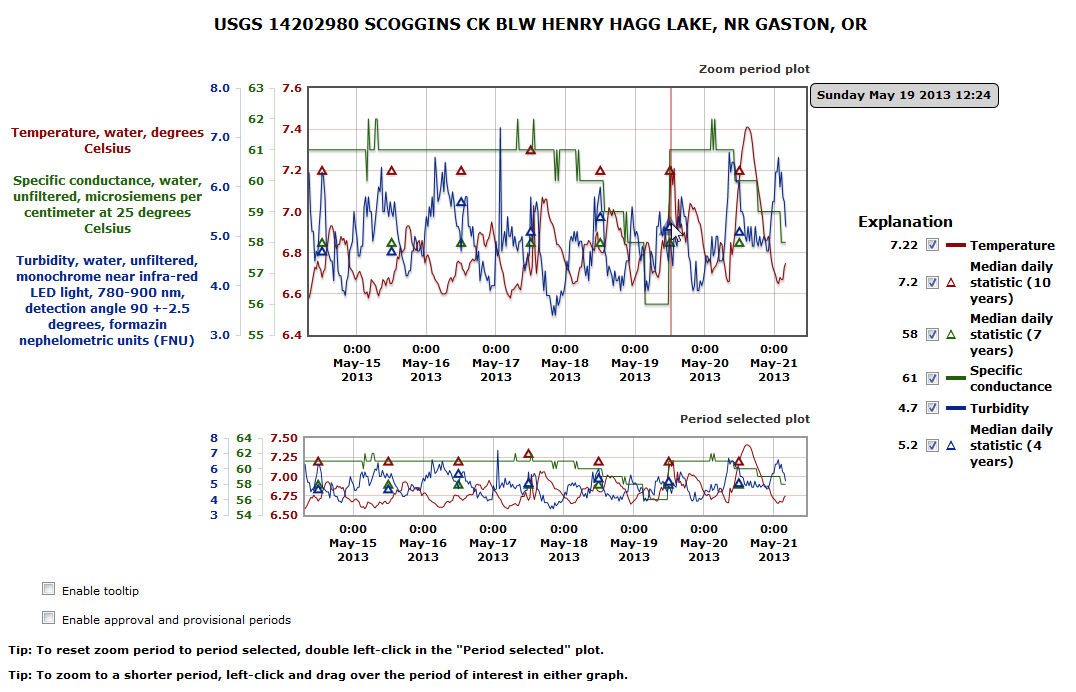
Another web page will be built that includes a graph of the three chosen parameter codes for this single site (shown below). There are two plots shown on this page. The upper plot called the "Zoom period plot" contains three lines for the chosen parameter codes: 1) Temperature; 2) Specific conductance; and 3) Turbidity. There are several features that can be enabled in the upper plot. The features include the ability 1) to zoom to shorter date/time intervals, 2) to toggle on and off lines and points/markers representing these data of the parameter codes, 3) to hover over specific points of any line to view detailed information about the value of the chosen point and date and time information, and 4) to show periods of approval/provisional intervals as well as periods for the site status and record qualification codes. The lower plot called "Period selected plot" provides an overview of the data record for the chosen parameter codes. This plot will remain unaffected by much of the activity applied to the upper plot. Any zooming activity applied to the upper "Zoom period plot" will be shown as a shaded rectangle that indicates the current interval applied to the upper plot. To reset the "Zoom period plot" to the original starting interval a double click of the cursor while hovering over the "Period selected plot" will trigger the reset event.
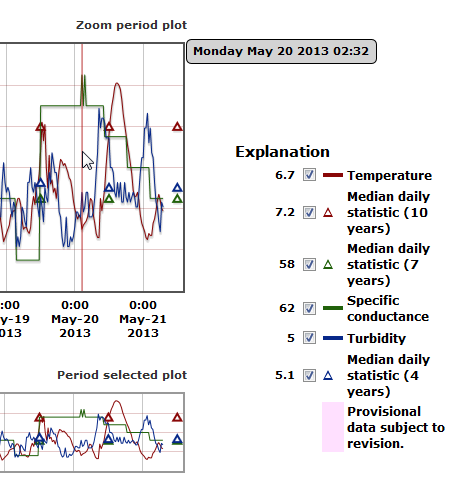
For this example of site 14202980 operated by the Oregon Water Science Center, the instantaneous record for three parameter codes has been plotted. Markers representing the mean daily statistical value available for each parameter code have been plotted as triangles and added to list of entries in the "Explanation" area. The feature monitored by the movement of the cursor across the "Zoom period plot" is shown as a vertical red scanner line indicating its present location as Sunday May 19 for 12:24. Values for this time event are shown for each enabled entry in the "Explanation" area. Only periods of approved and provisional record are available for display in the "Zoom period plot" and can be shown by enabling the check box below the "Period selected plot" for this site. If enabled descriptions for approved and provisional record will be added to the list of entries in the "Explanation" area.
Steps to produce graphs for PMSP (multiple sites for a single parameter code)
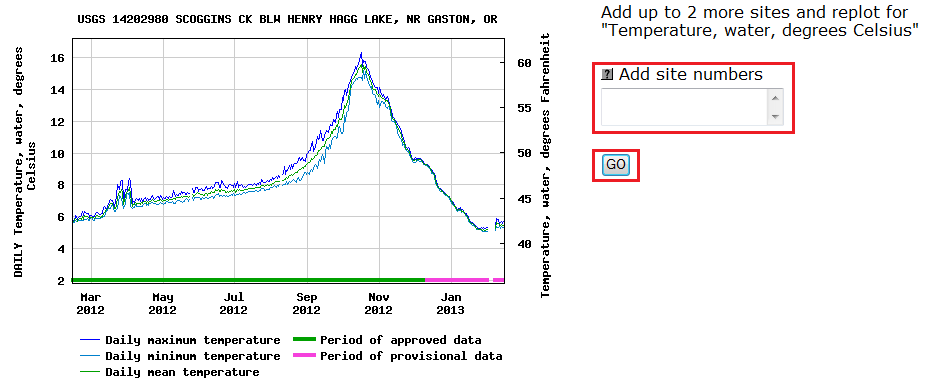
To produce a PMSP graph, one would add up to 2 site numbers into the input area of the "Add site numbers" section and then click the "GO" button. One could add another site 14207200 further downriver at the mouth of the Tualatin River in the text input box and click the "GO" button. These steps are outlined in red in the figure below. If these conditions of the options are not met correctly, a message will be enabled that will provide additional help.
Another web page will be built that includes a graph of the two chosen sites for a single parameter code (shown below). There are two plots shown on this page. The upper plot called the "Zoom period plot" contains two lines for the two chosen sites for the Temperature parameter code 00010: 1) USGS 14202980 Scoggins Creek below Henry Hagg Lake near Gaston, Oregon; 2) USGS 14207200 Tualatin River at Oswego Dam, near West Linn, Oregon. There are several features that can be enabled in the upper plot. The features include the ability 1) to zoom to shorter date/time intervals, 2) to toggle on and off lines representing these data of the parameter codes, 3) to hover over specific points of any line to view detailed information about the value of the chosen point and date and time information, and 4) to show periods of approval/provisional intervals as well as periods for the site status and record qualification codes. The lower plot called "Period selected plot" provides an overview of the lines for the two chosen sites. This plot will remain unaffected by much of the activity applied to the upper plot. Any zooming activity applied to the upper "Zoom period plot" will be shown as a shaded rectangle that indicates the current interval applied to the upper plot. To reset the "Zoom period plot" to the original starting interval a double click of the cursor while hovering over the "Period selected plot" will trigger the reset event.
For this example of two sites, 14202980 and 14207200, operated by the Oregon Water Science Center, the daily record for temperature has been plotted. In addition the mean, minimum, and maximum values have been generated for the temperature measurements collected at both sites. Three lines for each of these statistical values are group for each of the two sites by color, red and green. The "Zoom period plot" shows a specific interval (zoomed) of the period of interest graphed for these two sites. The specific interval presently shown in the "Zoom period plot" is displayed as a tan shaded rectangle in the "Period selected plot" and just double click on the lower plot to reset the upper plot to the specified duration. Only periods of approved and provisional record are available for display in the "Zoom period plot" and can be shown by enabling the check box below the "Period selected plot" for this site. If enabled descriptions for approved and provisional record will be added to the list of entries in the "Explanation" area.
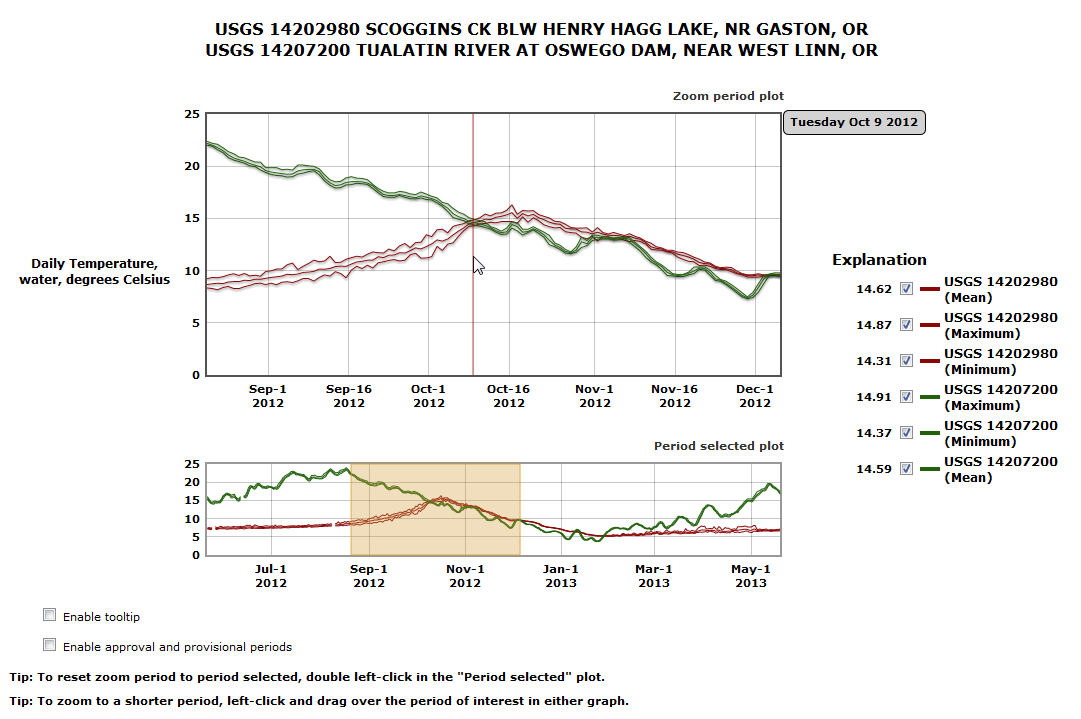
Features and layout of PMPS (multiple parameter codes for a single site) and PMSP (multiple sites for a single parameter code) graphs
Most features and the layout for the new graphing tool are available for both PMPS and PMSP. The basic layout shows both PMPS and PMSP have a "Zoom period plot" and a "Period selected plot" shown on each page. Each PMPS and PMSP have an explanation area located to the right of the plots where descriptions of the lines and symbols are recorded. In the portion following the plots there is an area containing a set of check boxes and tips. The user can interact with each plot to investigate the data that has been displayed by making use of the features in the "Explanation" and "Check boxes" areas. The "Zoom period plot" feature provides an interactive plot to investigate the instantaneous and daily record along discrete measurements and statistical values associated with a parameter code. The "Period selected plot" feature provides a reference plot of the specified duration. Zooming to shorter duration of interest can be achieved in the "Zoom period plot" by clicking and dragging the cursor. While in "Period selected plot" a shaded rectangle of this zoomed duration is shown. A tooltip feature can be accessed to provide additional detailed information of each data point of the instantaneous and daily record (part of the check box area below the "Period selected plot"). Control over the visibility of the lines or points of data for the instantaneous and daily record is triggered by the use of check boxes for each entry located in the "Explanation" area (see below).
Features of the Explanation area of PMPS (multiple parameter codes for a single site) and PMSP (multiple sites for a single parameter code)
The "Explanation" area contains a list of parameter codes plotted (PMPS) or a list of sites plotted (PMSP). Points and markers representing discrete measurements and statistical values can be included if available. Additional data such as periods for approved or provisional record, for codes of site status conditions, and for qualification conditions of each record and for displaying of measured discrete records and computed statistical values can be added to the list entries in the "Explanation" area if available. In the below figure three parameter codes were selected of instantaneous record (IV data): 1) Temperature, 2) Specific conductance, and 3) Turbidity. To remove one of the lines for a single parameter code (PMPS) or for a single site (PMSP), the check box associated with the entry such as Temperature will need to be unchecked. There will be a check box associated with each of the parameter code or site as well as entries for any of periods for approval and provisional record and the others. Discrete values that were measured periodically in the field are represented as a circle are plotted along with statistical values that are represented as a triangle are plotted too. For this example values for median daily statistics were computed for all three parameter codes. The ability to remove lines and other associated markers from the "Zoom period plot" reduces the number of lines and markers shown at any time and improves tracing a single line.
Another feature shown in the "Explanation" area is the value of each active parameter code or site listed. A red scanner line will follow the movement of the cursor across the "Zoom period plot" and values of each active entry are updated in the "Explanation" area. The value for each active entry appears to left of the check box in the list if the box is checked. The value represents the nearest data point in the record and are not interpolated. In addition the date and time information is displayed in a message adjacent to the upper right corner of the "Zoom period plot." The precision of the date and time is determined by the interval of the time series record: 1) for daily record to the nearest day, 2) for instantaneous record to the nearest minute.
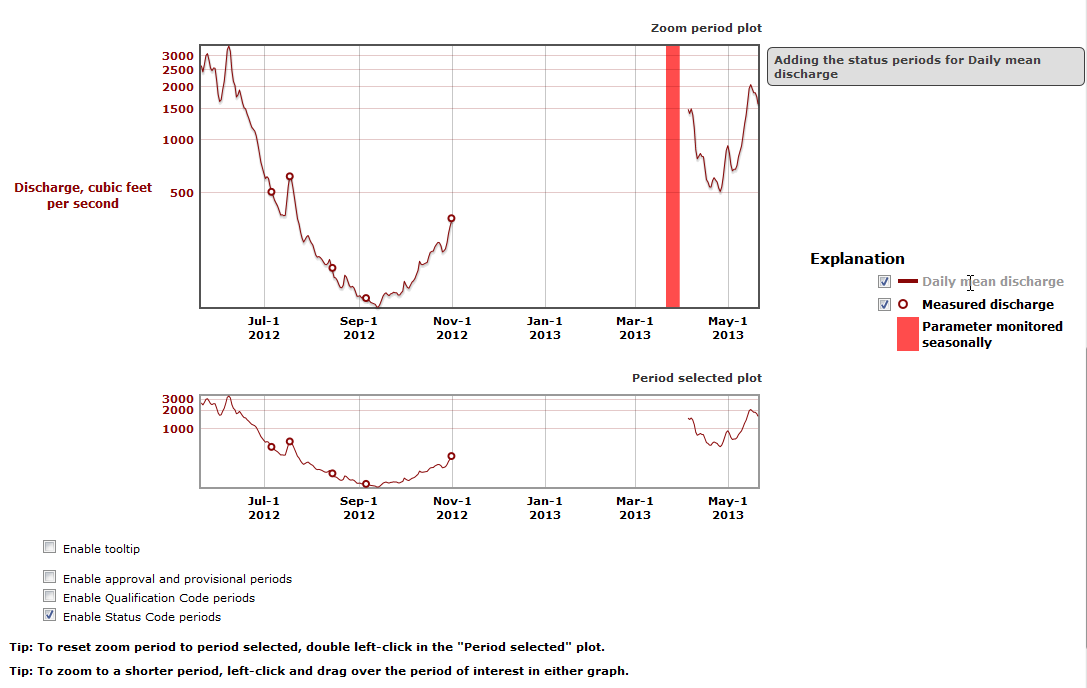
Features of Check boxes area of PMPS (multiple parameter codes for a single site) and PMSP (multiple sites for a single parameter code)
There is a set of check boxes following "Period selected plot" that includes a tool tip feature and several of other features to display periods of approval/provisional records. The feature called "Enable tooltip" will display more information on the individual data points of each line. Several of other check boxes can be shown following the "Enable tooltip" feature. The set of features is determined by the data record and other reference levels assigned by site, parameter code, and conditions of the data record. The following set of features can be available: 1) approval/provisional records, 2) conditions affecting a site, 3) conditions affecting each record (qualification codes), and 4) reference levels assigned to a site or data record. For the site 06024580 operated by the Montana Water Science Center, three sets of check boxes follow the "Enable tooltip" check box selection. A check box set has been created for each of the first three describing information on approval/provision, site status conditions and qualification codes. The fourth type of check box set for reference levels is unavailable for this specified duration or has not been assigned for the parameter code daily mean discharge for this site. Only one of the four set of check boxes can be enable at a single time. For this example below, the check box called "Enable Status Code periods" has been checked resulting in a red band showing for the duration where daily mean discharge was not measured since it is seasonally monitored. Equally the other two check boxes representing approval/provisional and qualification code durations can be enable to show bands of periods. As each check box is enabled or disabled additional entries are added or removed from the list in the "Explanation" area to describe each set. Each type can add one or more entries to the listing of the "Explanation" area if assigned to parameter for a site. For this example site a "Value has been estimated" entry will be added to the listing if the check box for "Enable Qualification Code periods" is enabled. For this example site both "Approved for publication -- Processing and review completed" and "Provisional data subject to revision" entries will be added to the listing if the check box for "Enable approval and provisional periods" is enabled.
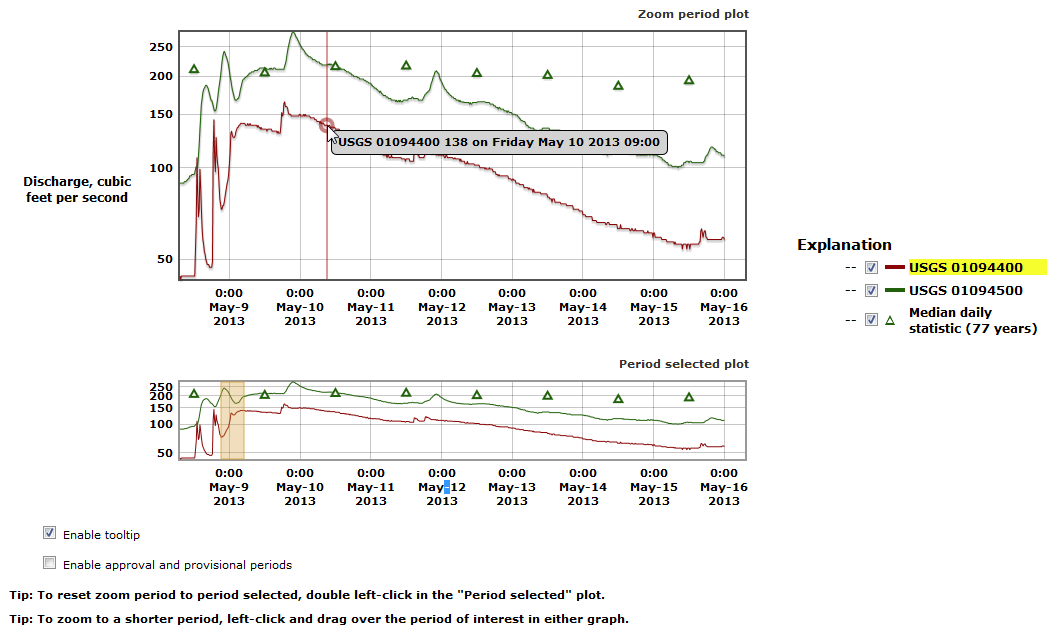
Feature showing the tooltip messages
The feature called "Enable tooltip" will display more information on the individual data points of each line (shown below). The feature is triggered with the first check box called "Enable tooltip" and causes an information message to appear when the cursor hovers over a data point of a record. The information message contains: 1) for PMPS a) a description of the parameter code, b) the value of the data point, and c) the date and time of the measurement; and 2) for PMSP a) the agency code and site number, b) the value of the data point, and c) the date and time of the measurement. The precision of the value for the data point will be determined according to rounding applied to accuracy of the measurement. The precision of the date and time will be determined according to the type of the time series records: 1) daily records will have the value of the date to the nearest day, and 2) instantaneous records will have the value of the time to the nearest minute. In addition the values showing for each entry in the "Explanation" area will be disabled while the tool tip feature is active. For the example below of instantaneous record, the cursor is hovering over the line representing the discharge records for the USGS site 0109440. The information shown in the tooltip message is for the nearest data point for the discharge record where the cursor is hovering. In addition the the hovering of the cursor also triggers a highlight function that causes a yellow background to appear around the activated entry in the list of the "Explanation" area. For the this example the entry of site 0109440 is illuminated with a yellow background.
The tooltip feature works with a PMPS graph as well. The message text contains information about the parameter, the value of the parameter, and the date and time of the record. The precision of the date and time are subject to rules applied for daily and instantaneous record. The hovering of the cursor would trigger yellow background around the parameter entry in the "Explanation" area.
Feature showing approval and provisional periods
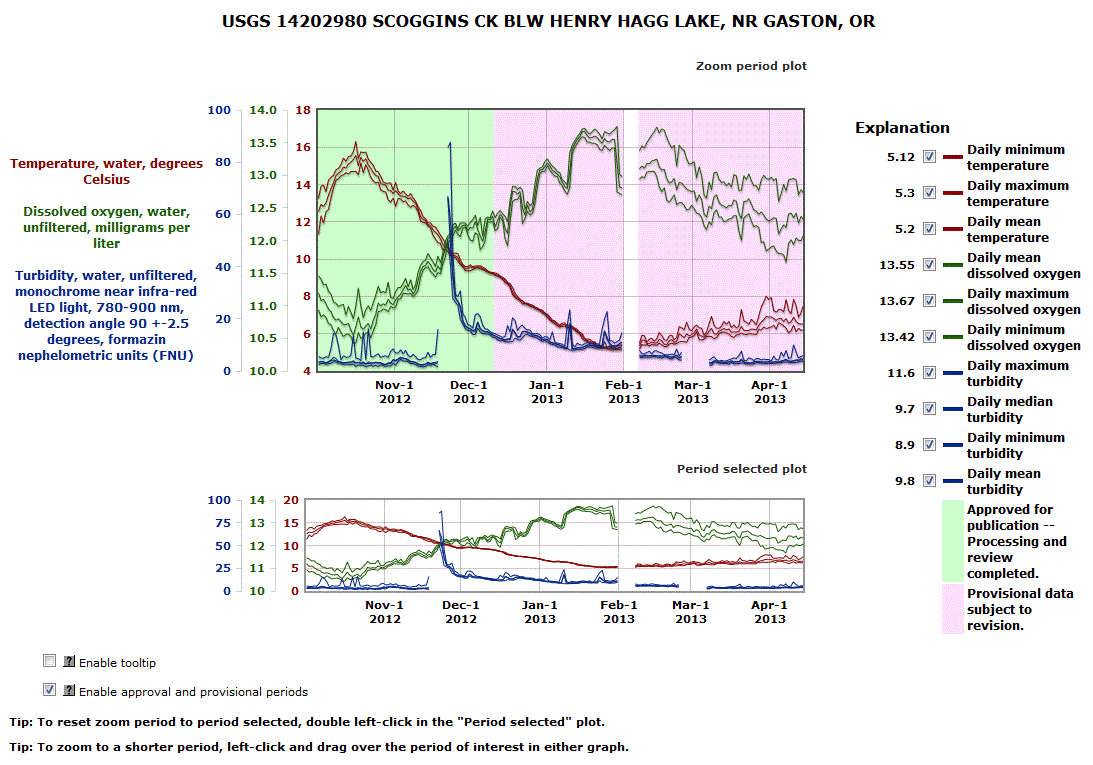
The feature showing the intervals of approval/provisional record is enabled by triggering the check box called "Enable approval and provisional periods" in the "Check boxes" area. Once enabled, the periods of approved or provisional record will appear as shaded intervals in the "Zoom period plot" when the cursor hovers over a specific entry in the "Explanation" area (see figure below). Periods of approval or provisional records are assigned for each site for a single parameter code. For the example below 200 days of daily value record was requested for site USGS 14202980 along with three parameter codes for water temperature, dissolved oxygen, and turbidity. In addition three statistics were computed for each parameter code: minimum, mean, maximum. The resulting graph contains three lines for each parameter code for the 200 days of interest. Some gaps appear in some of the lines due to site and data record conditions (more information will discussed in the next section). Two additional entries have been added to the list of the "Explanation" area. Each new entry is given a color and a text to specify the periods of approval and provisional record. With the cursor hovering over one of the dissolved oxygen entries, a brief message will appear to indicate adding the periods of approval/provisional record if available and the periods will appear as green and pink intervals on the "Zoom period plot." The blank gaps indicate other conditions have affected the data record. Periods of approval and provisional record can be shown for instantaneous record as well. The "Zoom period plot" for this site of instantaneous record would have only three lines (one for each of the three chosen parameter codes). The feature works for a PMSP graph (multiple sites for a single para
meter code) as well.
Feature showing the periods of site status conditions
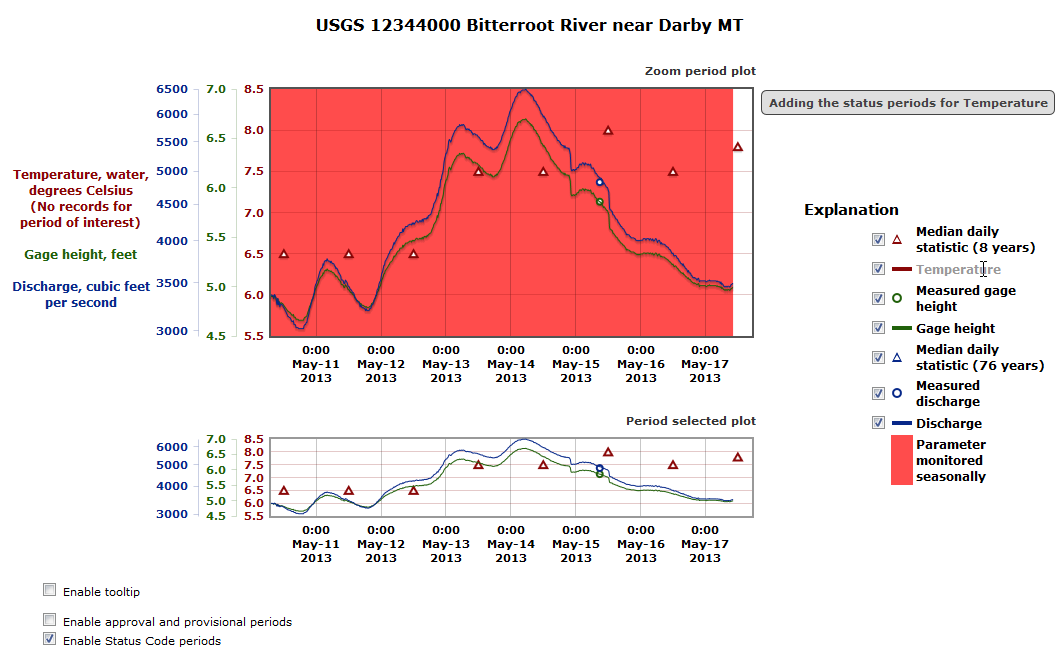
The feature showing the intervals of site status condition records is enabled by triggering the check box called "Enable Status Code periods" in the "Check boxes" area. This feature will be shown if the site status conditions are present in the daily and instantaneous record specified for the duration of the graph. The site status condition information is maintained for each site by the individual Water Science Centers. For an example in the following graph (PMPS) three parameters for 1) Temperature, 2) Gage height, and 3) Discharge are shown. The feature to show site status conditions has been enabled for this site 12344000 operated by the Montana Water Science Center. Once enabling this feature one or more site status conditions are added to the list of entries in the "Explanation" area. Each entry will consist of a box colored to uniquely identify each site status condition and a description to explain the site status condition applied for a specific duration. A site status condition can be applied to indicate equipment failure over a duration of days or for this example a seasonal period where no data is collected due to weather conditions or access to the site (shown with red shading). To activate showing a site status condition for each active parameter or site list in the "Explanation" area, the hovering over the entry will cause the display of site status condition to be shown in "Zoom period plot", a brief message will be displayed adjacent to the "Zoom period plot" indicating there is a site status condition for this parameter or site, and finally the text of the specific entry will change from black coloring to gray coloring of the text. If there is no site status condition applied for an entry, a brief message will indicate no period available. In addition, the hovering over any entry of parameters or sites will cause a graying of the text of the specific entry.
Feature showing the periods of qualification codes
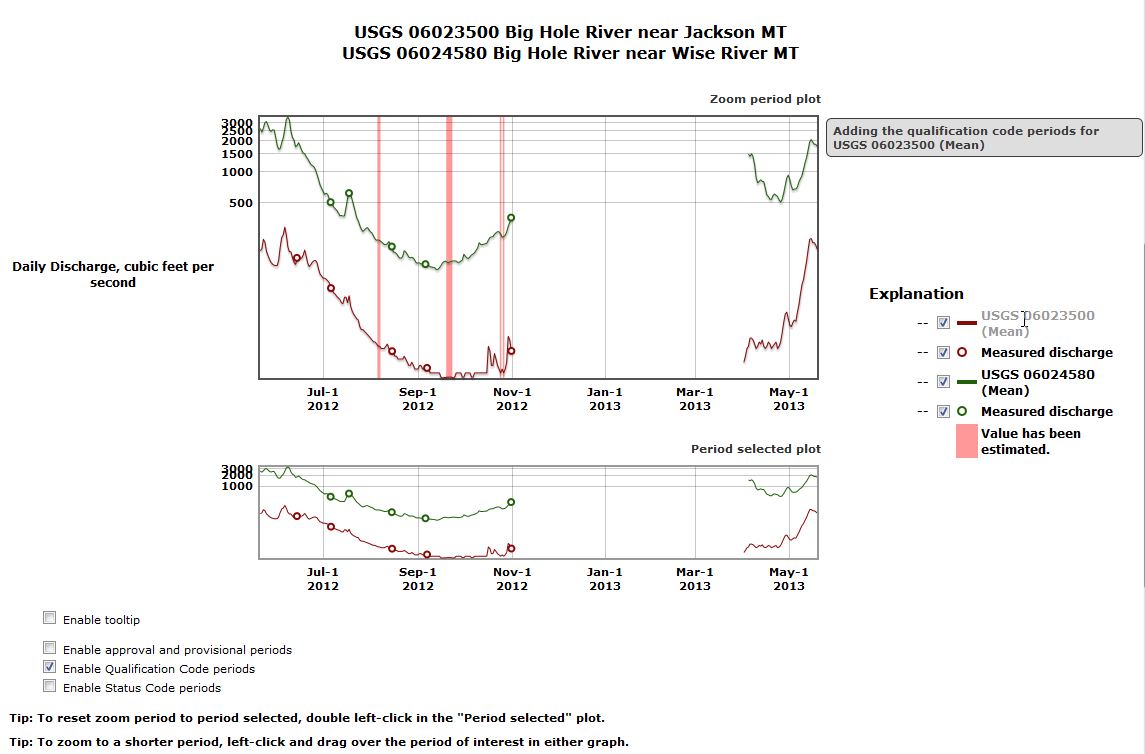
The feature showing the intervals of qualification codes records is enabled by triggering the check box called "Enable Qualification Code periods" in the "Check boxes" area. This feature will be shown if the qualification codes are present in the daily and instantaneous record specified for the duration of the graph. The qualification codes information is applied to each daily or instantaneous record during the processing for each real-time site at the individual Water Science Centers. The feature to show qualification codes has been enabled for two sites, 06023500 and 06024580, operated by the Montana Water Science Center. Once enabling this feature one or more qualification codes are added to the list of entries in the "Explanation" area. Each entry will consist of a box colored to uniquely identify each qualification code and a description to explain the qualification code applied for a specific duration. A qualification codes can be applied to indicate the value of the instantaneous or daily record has been affected by ice at the measurement site or the value is known to less or greater than the reported value of the record. For this example the values of several daily records have been estimated (shown as several pink bands). To activate showing a qualification codes for each active parameter or site list in the "Explanation" area, the hovering over the entry will cause the display of qualification codes to be shown in "Zoom period plot", a brief message will be displayed adjacent to the "Zoom period plot" indicating there is a qualification codes for this parameter or site, and finally the text of the specific entry will change from black coloring to gray coloring of the text. If there is no qualification codes applied for an entry, a brief message will indicate no period available. In addition, the hovering over any entry of parameters or sites will cause a graying of the text of the specific entry. The cursor was hovering over the entry for mean discharge for site 06023500 in the "Explanation" area. Four periods of qualification codes for estimating the daily records were shown a pink colored bands. In addition, there are site status conditions that can be shown as well for these two sites. Only one of the check boxes for periods and reference levels can enabled at a time.
Feature showing the reference levels
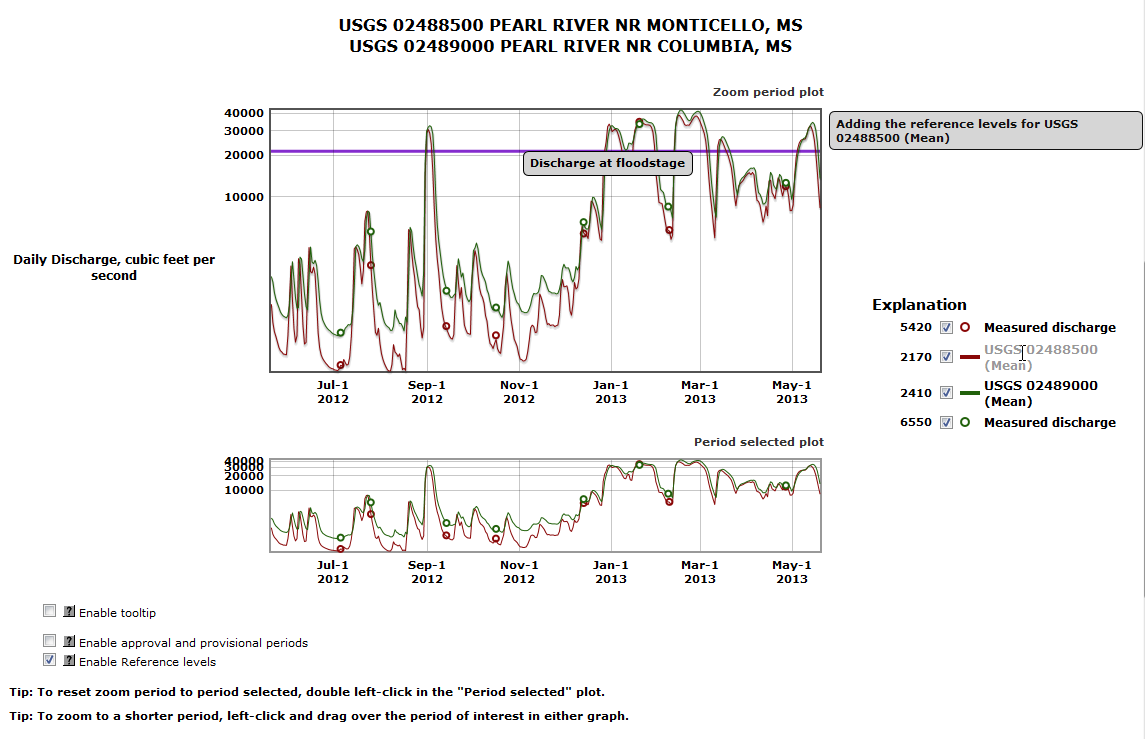
The feature showing the lines representing reference levels is enabled by triggering the check box called "Enable Reference levels" in the "Check boxes" area. This feature will be shown if the reference levels have been assigned for the daily and instantaneous record specified for the duration of the graph. The reference levels information is assigned to the daily or instantaneous record during the processing for each real-time site at the individual Water Science Centers. The feature to show reference levels has been enabled for two sites, 02488500 and 02489000, operated by the Mississippi Water Science Center in the figure below. Once enabling this feature a reference level can be shown for each site for mean daily discharge record. For this example the reference level for flood stage of mean daily discharge for site 0248850 has been added to the "Zoom period plot" in the figure below. Text describing the reference level information is positioned in a popup beneath the line representing the reference level. The reference level shown below indicating a flood stage is reached when the mean daily discharge passes 20,000 cubic feet per second. There are many other types of reference levels that can be assigned to other types of data collected at a site such as detection levels for water-quality measurements. Reference level information provides additional information that can be important in determining flood stages for emergency planning.
