Using the table sorter
Many pages on the USGS Water Data for the Nation Site contain tabular data (data in tables with rows and columns). Many of these tables are "intelligent", allowing sorting and filtering of data in the table, as well as certain usability features. This tutorial shows common ways of using the table sorter. For complete documentation refer to the Tablesorter plug in for jQuery.
Identifying sortable tables
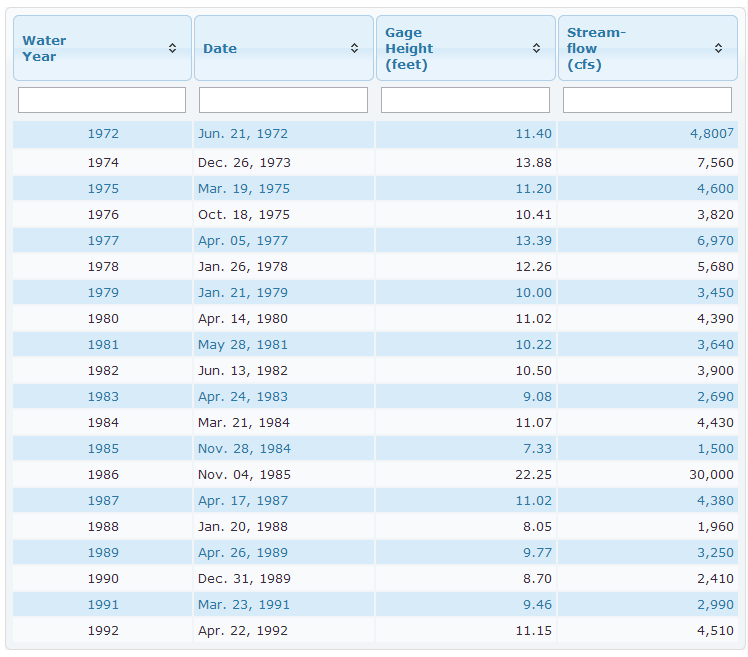
Sortable tables are easy to identify because they are colorful. Table rows have alternating colors and the second row contains a filter line. Here is an example of a sortable table:
Row highlighting
It can be hard to focus on one row of a large table. Simply move your mouse over the row. Depending on how the table is configured for display, either the row will appear with a highlighted background color or the font weight will change.
Simple sorting
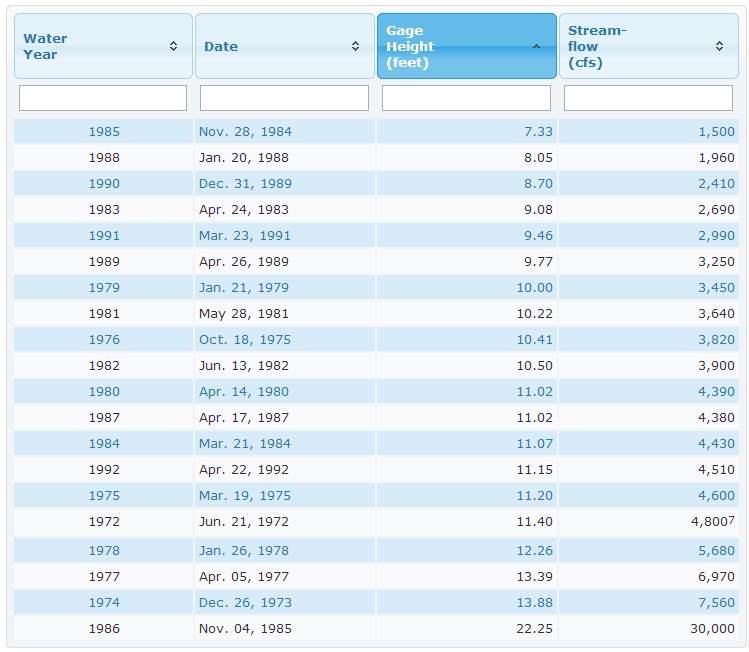
Simple sorting involves sorting on a single column only. This is done by selecting (generally clicking with a mouse) the column header. Clicking once on the gage height header, for example, sorts the rows by gage height in ascending sequence. The column header is highlighted to let you know the table was sorted by that column.
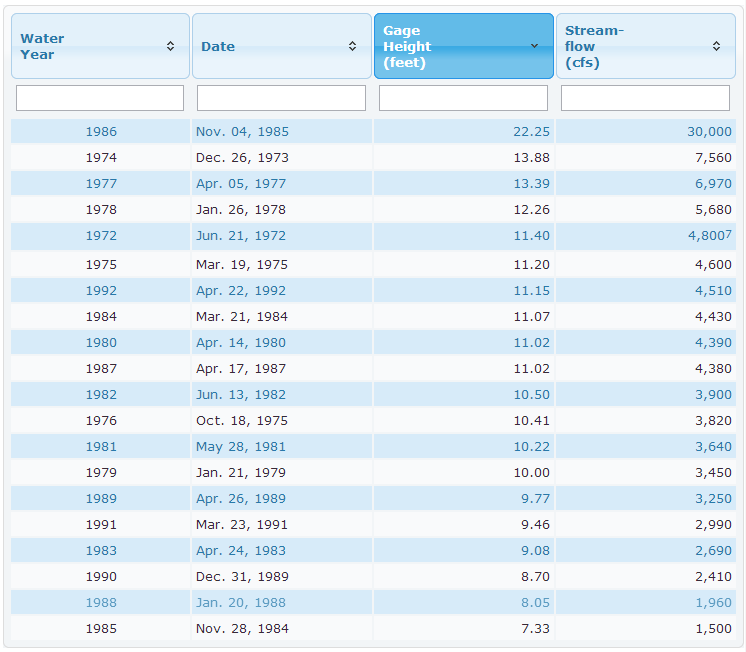
Click on the column header again to get a descending sort.
Note that carats (arrowheads) pointing up or down in the column header indicate the direction of the sort. If both are present, the column has not been explicitly sorted by the user with the table sorter.
Multi-column sorting
Sort multiple columns simultaneously by holding down the shift key when clicking a second, third or even fourth column header. Sorting occurs in the order clicked. For example, click first on the Stream-flow column and, while holding down the shift key, click on the Date column; if two rows have the same stream flow measurement, the first row will have the earlier measurement date. To remove the sort do not hold the shift key down then click on another column.
Basic filtering
To find a specific value simply type it in the filter field under the appropriate column header. This example shows all rows with a gage height of 11.02 feet. To remove the filter, simply click on the X in the filter field.
Advanced filtering
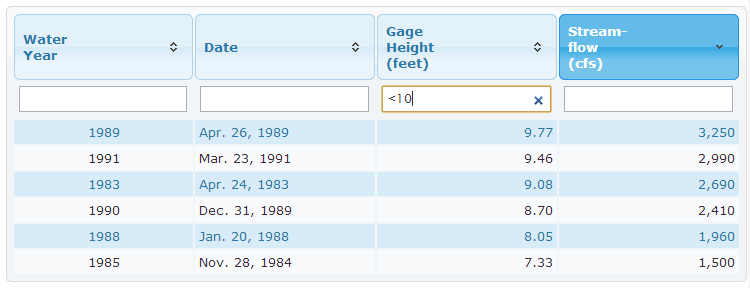
You can filter by an expression. This allows you to find values equal to (=), greater than (>), greater and equal to (>=), less than (<), less than or equal to (<=), or not equal (<>) to a value. Equal to is the default. This example shows rows with a gage height of less than 10 feet:
You can combine filters across various columns. When you do this, the results are logically ANDed; i.e. they must meet both criteria for the row to show. In this example, we are interested in when the gage height was less than 10 feet before 1990:
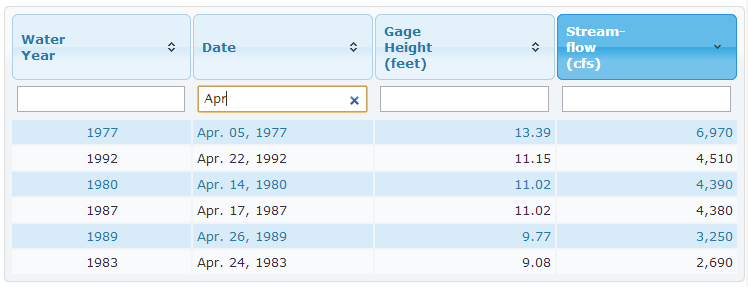
You can also filter on characters (strings), if they are in a column. In this example we see all measurements that occurred in April, by matching "Apr" in the date column:
Warnings
The table sorter is a display feature only. You cannot use it to filter rows for exporting tab-delimited (RDB) files.
Questions?
If you have any questions on using the table sorter, write us.
