A primer on downloading data
Downloading Data
The USGS Water Data for the Nation site is a vast repository of water data, both recent and historical, in some cases spanning over a hundred years. Virtually all of the data shown on the site can be downloaded. This tutorial explains the basics on how data is downloaded.
Topics in this tutorial:
- USGS Water Services
- Beginning your search
- Refining searches
- Outputting data
- Loading tab-delimited files into Excel
- Automated retrievals
USGS Water Services
If you expect to develop an application or computer program that periodically downloads data, then it is recommended that you use the USGS Water Services site instead. The USGS Water Services site is relatively new. Not all data available on this site can be downloaded from the USGS Water Services site yet. Over time this will change. The USGS Water Services site will offer more modern and media-friendly ways to acquire data and in most cases delivers the data more quickly.
Data downloaded from this site are largely delivered as tab-delimited files of data. This kind of file generally requires more effort to extract data than friendlier XML and similar formats offered by the USGS Water Services site.
USGS Water Services currently supports an instantaneous (current condition), daily values, groundwater levels and a site service.
Beginning your search
There are no special tricks in finding data to download versus searching for it for display. Whether searching for current condition, site, surface water, groundwater or water quality data, the process is the same. The trick is to search for data as any human would but select a tab-delimited output. (XML is available for site data.) When trying to automate the process, you can copy and paste the resulting URL in your browser into your application.
Select Data Category and Geographic Area
This is the easiest way to start your search for data because you can find these controls on any web page on this site. Look for the two drop down controls near the top right corner of the web site. First, select the data category and geographic area that is closest to what interests you. Then press the GO button.
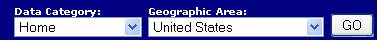
Figure 1. Selecting Data Category and Geographic Area of interest
Other ways to search for data
There are other ways to select data. Since they are more complex than using the Data Category and Geographic Area drop down boxes, examples are not shown.
- Select a data category button from the site's or a state's home page. These buttons appear on the left side of the page. Some examples:
- This site's home page is http://waterdata.usgs.gov/nwis
- The state of Texas has its home page at http://waterdata.usgs.gov/tx/nwis (If you know the postal abbreviation for a state, you can substitute it for tx to go to that state page.)
- If interested in current condition data, you can use the current condition image maps to focus on a state or site.
- From the national current condition page at http://waterdata.usgs.gov/rt click on the state of interest to go to that state's current condition page.
- From a state current condition page, such as http://waterdata.usgs.gov/tx/nwis/rt, you can click on one of the color dots to get to that site's current condition page. Links on that page take you to pages where you can refine your query for that site and download its data.
- You can use the National Water Information System Mapper to find sites geographically with relevant sites show on a map. The Mapper shows up under the Data Category drop down or can be found as a button on the site's home page or on a state's home page. While you can see all sites in various data categories, you can only select to view one of them. This is done by being at Zoom Level 11 or higher, clicking on the symbol associated with the site, then clicking the Access Data link in the pop up. Links on that page take you to pages where you can refine your query for that site and download its data.
Refining Searches
At this point you have identified the data category and geographic area. Before downloading data, you must further refine your search to tell the system what you want. There are two steps:
- Refine your list of sites. For example, you might be interested in sites within a particular country, or within a lat/long box.
- Decide the type of data you want from these sites. For example, if interested in streamflow, you need to tell the system that you want streamflow.
Refining your list of sites
Downloaded data is typically arranged in columns and rows, i.e. as tabular data. Therefore, selecting the Build Current Conditions Table link on the appropriate USA or state data category page is generally the easiest way to refine a list of sites
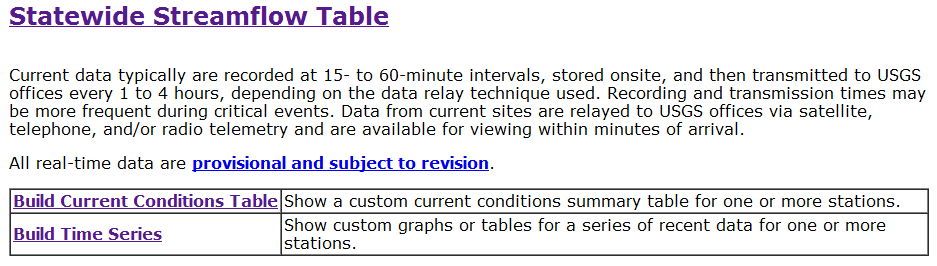
Figure 2. Select the Build Current Conditions Table link from the USA or state page.
The site selection criteria page appears next. Your criteria for finding sites can include location, identifier, site attributes or data attributes. The criteria may vary slightly depending on the data type. In this example, we want to refine a list of sites to one or more counties, so that checkbox is checked:
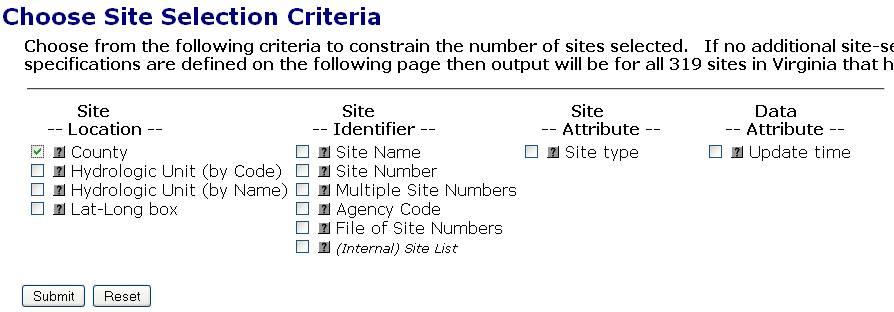
Figure 3. Refining site selection criteria by county.
When you submit the form, you are then given a longer page where you specify the site and data selection criteria that interest you. The page will be formatted differently depending on the site criteria and data types that interest you. In this example, assume we have specified Virginia as a geographic area of interest. We now want to refine our list of current condition sites in Virginia only to those in Fairfax County:
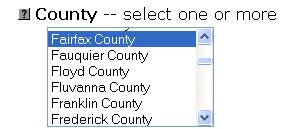
Figure 4. Specifying site selection criteria.
Deciding the data you want
Right below it, we select the USGS parameters of interest. Parameters represent the kind of data that interest us. In the example "1" and "2" are filled out by default (we want output to show station name and the date and time), "3" and "4" were added and indicate we want stage (third column) and streamflow (fourth column) data for these sites. The numbers 1 through 4 indicate the sequence that data should appear in the output. In this case, site name appears first and streamflow appears last.
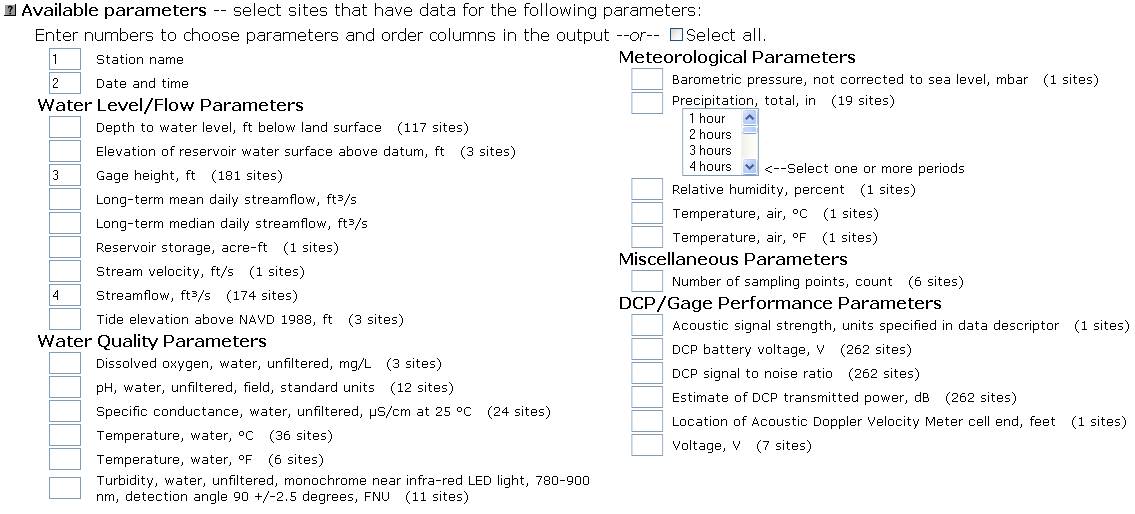
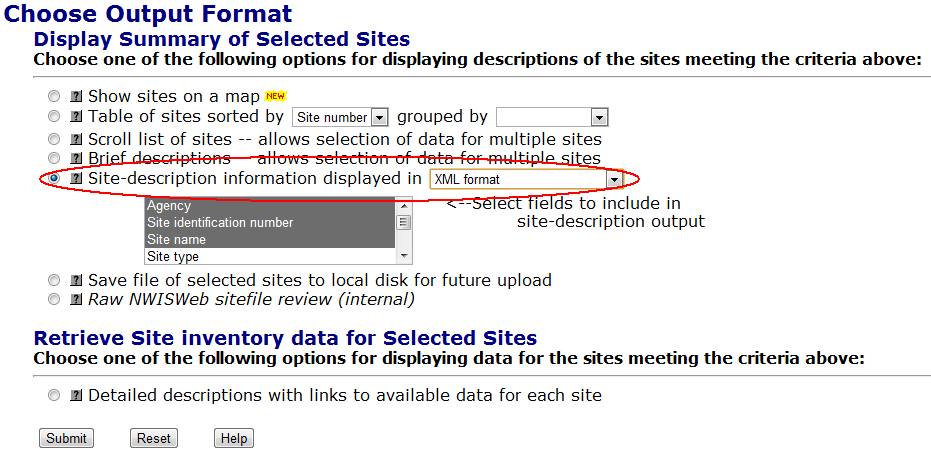
Figure 5. Selecting data attributes
Altogether, our query is saying "Give me station name, date and time of the observation, then the gage height and streamflow data for that observation for all current condition sites in Fairfax County, Virginia."
Outputting Data
Outputting data as tab-delimited
Data is normally formatted for reading within a browser, not for data processing, so by default a HTML web page will appear. You can get either summary data or detailed data.
- Getting Detailed data
- Select the option shown in Figure 6.
- From the dropdown the select tab-separated format, either "saved to file" or "saved to compressed file". Normally you will want the data sent to you as an uncompressed file.
- Getting Summary data
- Click on the "Site-description information displayed in" button
- From the dropdown the select tab-separated format, either "saved to file" or "saved to compressed file". Normally you will want the data sent to you as an uncompressed file.
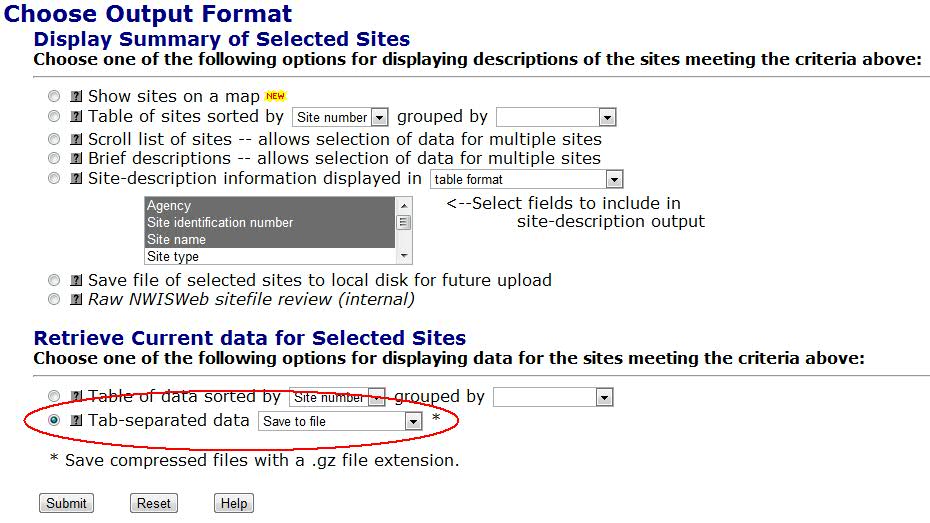
Figure 6. Selecting tab-delimited output to a file
Outputting site data as XML
Site data can be output in XML. However, the format is very rudimentary. Using the Site Web Service is preferred. The example below shows how to select site data with XML output.
Figure 7. Selecting XML output for site data
Saving the data
When using a browser, the browser determines how to handle downloaded files. This example shows a dialog box that appears with the Firefox 3.6 browser. The name of the file will vary depending on the category of data you are downloading. Generally, you can save it anywhere you want.
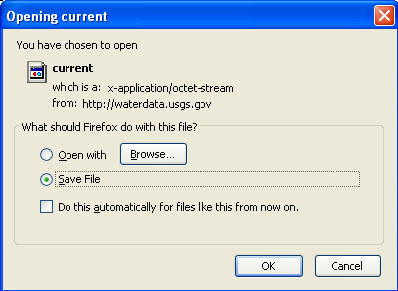
Figure 8. Example of downloading data dialog box (Firefox shown)
Renaming the data file
When downloading to a personal computer or file server, after you have saved your file, you may find it easiest to rename the file with an appropriate file extension. For example, on Windows if you give the downloaded file "current" the name "current.txt", then Windows will assume the file is text. This allows it to be easily opened in programs like Notepad to be viewed. To rename a file in Windows:
- Right mouse click on the file
- Select "Rename"
- Enter the file name desired, but make sure it ends in an appropriate text extension like ".txt".
Tab-delimited file format
The USGS uses a tab-delimited file format called RDB.
- Lines that are comments begin with a #.
- After standard disclaimers come comments that show a list of column names with column descriptions that will appear in the data section of the file.
- The first non-comment line is a header line.
- Each subsequent line is a line of data.
- Fields are separated by ASCII-9 tab characters that are invisible. When loaded into certain tools (like Microsoft Excel), tab-delimited data will align nicely for presentation.
- Lines are delineated with Unix line endings (ASCII-10 characters). This means if the file is examined in Windows applications like Notepad, it may all appear strung together on one line.
An example RDB tab-separated file appears below:
#
# U.S. Geological Survey
# National Water Information System
# Retrieved: 2011-03-17 13:47:15 EDT      (sdww03)
#
# ---------------------WARNING---------------------
# The data you have obtained from this automated
# U.S. Geological Survey database have not received
# Director's approval and as such are provisional
# and subject to revision.  The data are released
# on the condition that neither the USGS nor the
# United States Government may be held liable for
# any damages resulting from its use.
#
# Further Descriptions of the parameter_cd column can be found at:
# http://waterdata.usgs.gov/nwis/pmcodes
# Further Descriptions of codes in the result_cd column can be found at:
# http://waterdata.usgs.gov/nwis/help?codes_help#surface_water
#
# This information includes the following fields:
#
#  agency_cd    Agency Code
#  station_nm   Station Name
#  site_no      USGS station number
#  dd_nu        Data Descriptor Number
#  parameter_cd Parameter Code
#  result_dt    Date that the result was taken
#  result_tz_cd Time datum
#  result_va    Current value
#  result_cd    Code to show data quality
#  result_md    Date the result was modified in the NWIS database
#
agency_cd	site_no	station_nm	dd_nu	parameter_cd	result_dt	result_tz_cd	result_va	result_cd	result_md
5s	15s	50s	2n	5s	12d	6s	12s	2s	12d
USGS	01645704	DIFFICULT RUN ABOVE FOX LAKE NEAR FAIRFAX, VA	01	00065	2011-03-17 13:00:00	EDT	1.45		2011-03-17 13:18:17
USGS	01645704	DIFFICULT RUN ABOVE FOX LAKE NEAR FAIRFAX, VA	02	00060	2011-03-17 13:00:00	EDT	12		2011-03-17 13:18:17
USGS	01645762	S F LITTLE DIFFICULT RUN ABOVE MOUTH NR VIENNA, VA	01	00065	2011-03-17 13:00:00	EDT	1.35		2011-03-17 13:18:17
USGS	01645762	S F LITTLE DIFFICULT RUN ABOVE MOUTH NR VIENNA, VA	02	00060	2011-03-17 13:00:00	EDT	2.7		2011-03-17 13:18:17
USGS	01646000	DIFFICULT RUN NEAR GREAT FALLS, VA	01	00060	2011-03-17 13:15:00	EDT	66		2011-03-17 13:38:08
USGS	01646000	DIFFICULT RUN NEAR GREAT FALLS, VA	03	00065	2011-03-17 13:15:00	EDT	3.51		2011-03-17 13:38:08
USGS	01646305	DEAD RUN AT WHANN AVENUE NEAR MCLEAN, VA	01	00065	2011-03-17 13:00:00	EDT	1.52		2011-03-17 13:18:17
USGS	01646305	DEAD RUN AT WHANN AVENUE NEAR MCLEAN, VA	02	00060	2011-03-17 13:00:00	EDT	2.4		2011-03-17 13:18:17
USGS	01654000	ACCOTINK CREEK NEAR ANNANDALE, VA	01	00060	2011-03-17 12:45:00	EDT	43		2011-03-17 13:18:17
USGS	01654000	ACCOTINK CREEK NEAR ANNANDALE, VA	08	00065	2011-03-17 12:45:00	EDT	2.52		2011-03-17 13:18:17
USGS	01656903	FLATLICK BRANCH ABOVE FROG BRANCH AT CHANTILLY, VA	01	00065	2011-03-17 13:00:00	EDT	0.82		2011-03-17 13:18:17
USGS	01656903	FLATLICK BRANCH ABOVE FROG BRANCH AT CHANTILLY, VA	02	00060	2011-03-17 13:00:00	EDT	7.0		2011-03-17 13:18:17
Loading tab-delimited files into Excel
This example assumes a file with tab-delimited data was downloaded and renamed current.txt. It also assumes Excel 2010 is used.
- Open Excel 2010
- Click on the File in the top left corner
- Select a filter that will allow the file to be seen, for example the Text Files (*.prn, *.txt, *.csv) option. Find the file and select it.
- Select Open
- Navigate to your download area
- Select files of type text
- Click on the file then press Open
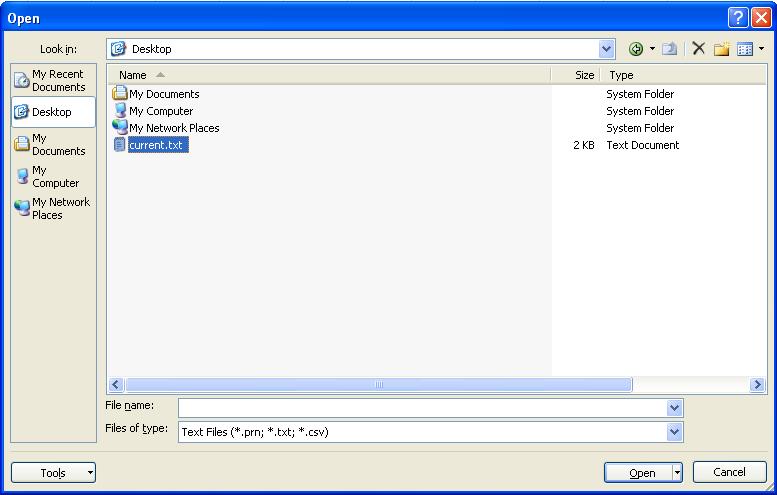
Figure 9. Opening a text file in Excel
You will be presented with a three step wizard. Each step uses the defaults, so you can save time by pressing Finish on the first screen.
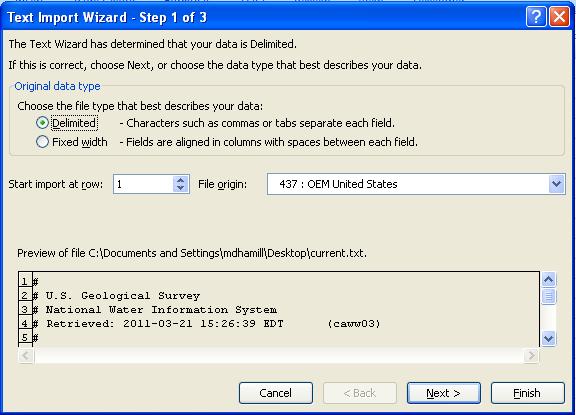
Figure 10. Excel text import wizard
The data should appear in a blank worksheet. If you see ###### in a column, this is Excel's way of telling you that you need to drag the width of the column to see all the data.
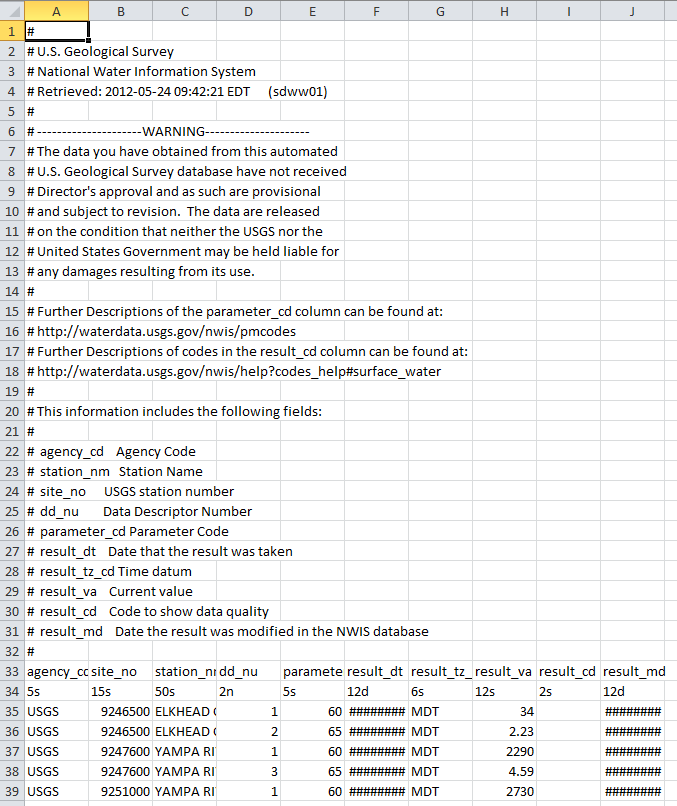
Figure 11. Tab-delimited data loaded into Excel
Adjust the worksheet as you desire. You may wish to save the result as a native Excel spreadsheet by pressing the Office button, select Save As then select Excel Workbook.
Automated Retrievals
If you intend to develop an application to regularly download data from this site, there is plenty of advice on the Automated Retrievals page which includes a number of examples for downloading current condition, daily values and site data